Introduction: The Challenger Disaster and the Origin of the SPOF Concept
In 1986, the Challenger space shuttle exploded 73 seconds after liftoff. The cause was a failed rubber O-ring in the right solid rocket booster—rendered brittle by cold weather. This seemingly minor mechanical flaw resulted in the deaths of seven astronauts and halted NASA’s shuttle program. The tragedy was a stark example of a Single Point of Failure (SPOF): when one component’s failure cascades into a systemic collapse.
This case has since become an iconic reference point for SPOFs across domains—engineering, business, and increasingly, cybersecurity.
Modern Cybersecurity Infrastructures and SPOF Examples
In digital environments, SPOFs often lie hidden in centralized systems such as:
- Authentication servers (e.g., Active Directory, HSS)
- Update deployment tools (e.g., SCCM)
- Gateway routers and single-region cloud architecture
If these nodes are compromised or fail, the entire infrastructure can become vulnerable to complete disruption or undetected exploitation.
Modeling Infrastructure as a Graph: Attack Paths and SPOF Detection
This analysis was conducted using a custom toolset available at the spofInCybersecurity GitHub repository, which defines infrastructure as a graph (graph.json) and simulates SPOF impact through path enumeration and node removal.
This analysis uses a graph model of real infrastructure, structured as graph.json, to simulate and measure SPOF impact.
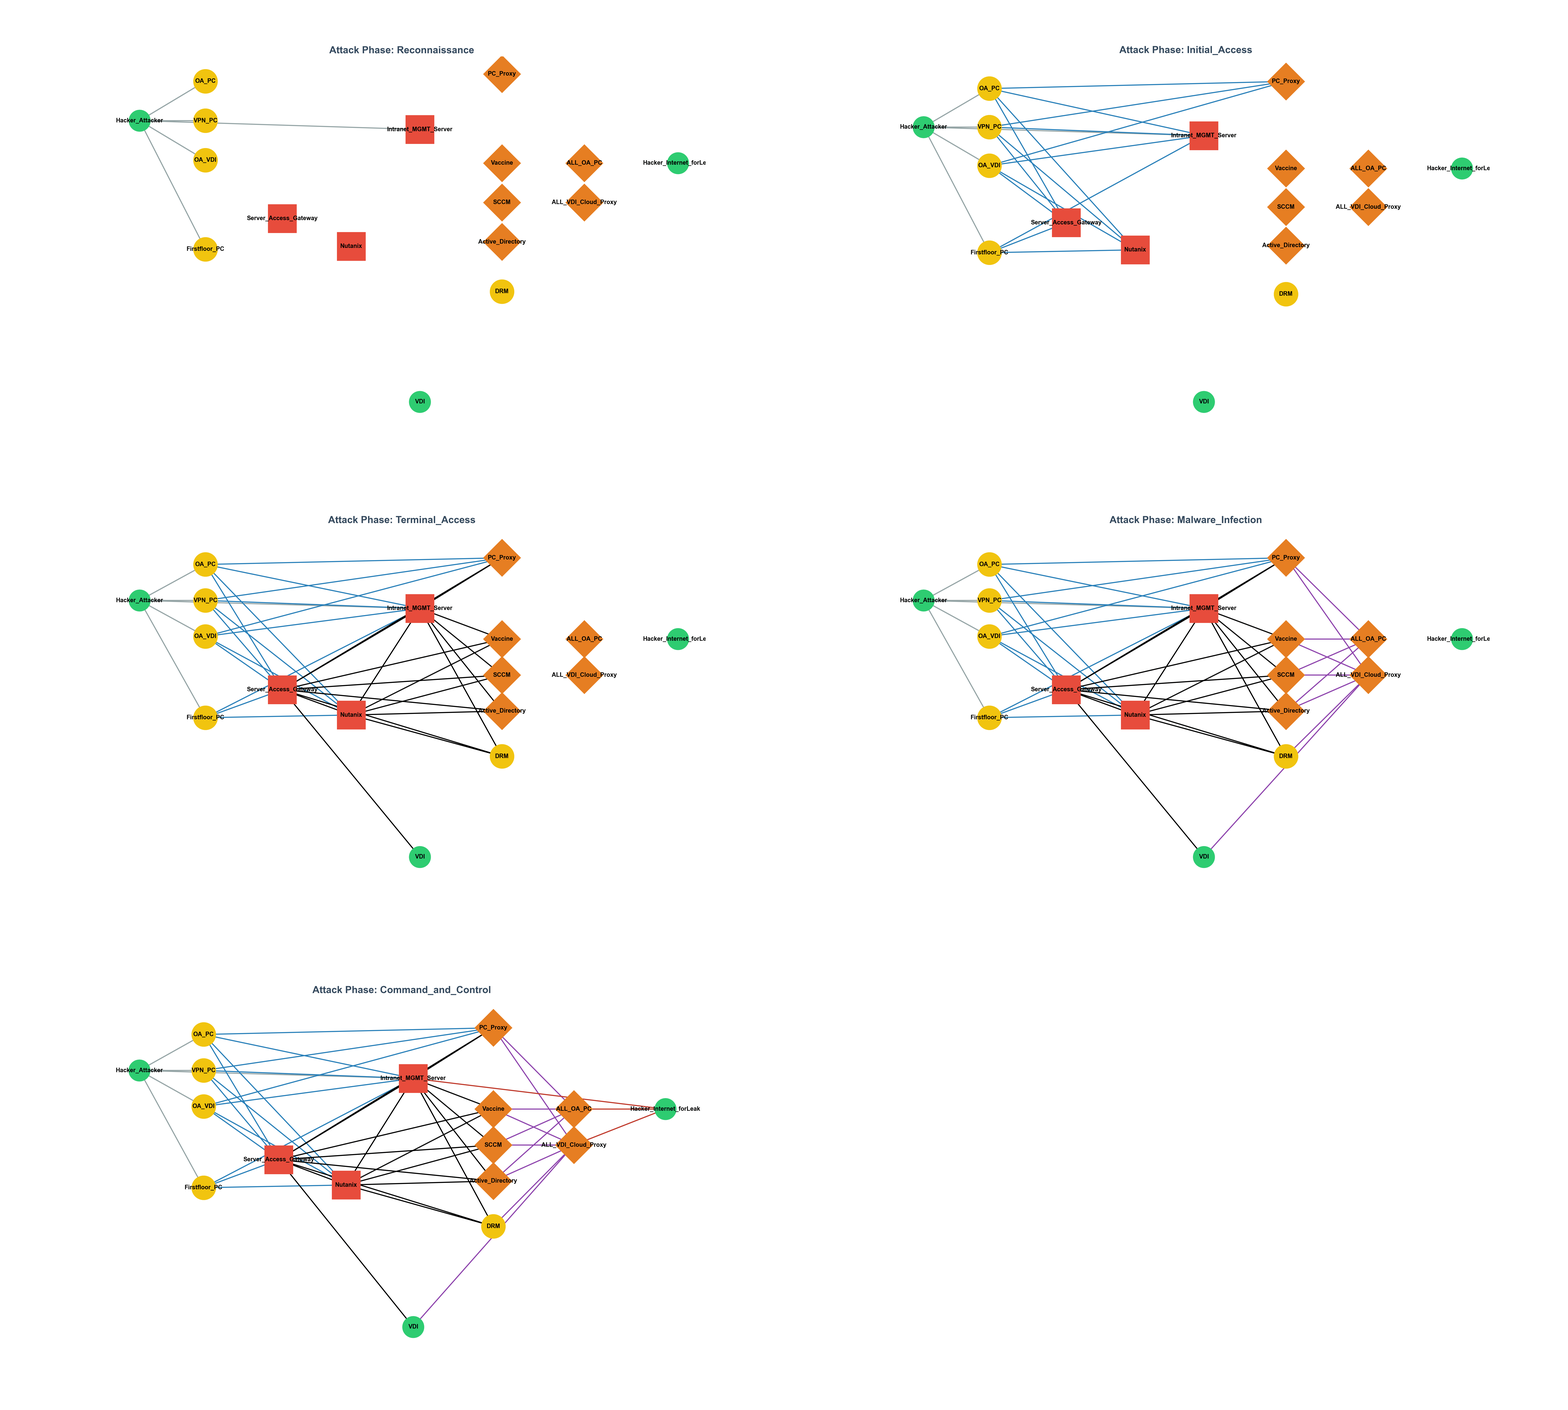
Each node represents an asset (PC, server, firewall, etc.), and edges represent logical or physical communication paths. We defined representative attack flows as:
Entry → VPN/VDI Access → Privilege Escalation → Malware Infection → Data Exfiltration
The graph was constructed using LLMs (e.g., ChatGPT) that processed natural language documentation (network diagrams, audit reports, firewall rules) and converted it into a structured format for analysis.
Methodology: Weighted Path Enumeration and Node Removal Simulation
This analysis approximates a node’s structural centrality using real-world attack paths. Specifically:
- Enumerate all simple paths from entry to exfiltration points.
- Count each node’s frequency as a middle-step (excluding start/end).
- Apply weights (e.g., OA_PC = 0.0005, server = 1.0) to reflect operational significance.
- Remove each node and recalculate total reachable paths. Drop rate = SPOF impact.
This yields an empirical approximation of betweenness centrality, tailored for cybersecurity threat modeling. Unlike abstract graph theory metrics, this approach grounds centrality in actual threat modeling. Each node’s importance is derived from its real role in reachable attack paths—making it a practical and scenario-aware approximation for SPOF detection.
Visualization: Structural SPOFs in the Graph

Figure 1 shows the infrastructure graph, color-coded by SPOF severity:
- Red = Absolute SPOF (removal cuts >50% of attack paths)
- Yellow = Relative SPOF
- Blue = Redundant but still impactful
- Gray = Low priority
Visualizations also revealed structural bottlenecks—critical systems were routed through a single gateway, creating latent SPOFs even in seemingly segmented architectures.
Key nodes (based on 470 path samples):
Figure 1 shows the infrastructure graph, color-coded by SPOF severity:
- Red = Absolute SPOF (removal cuts >50% of attack paths)
- Yellow = Relative SPOF
- Blue = Redundant but still impactful
- Gray = Low priority
Key nodes (based on 470 path samples):
- Intranet_MGMT_Server: 61.7% of all paths
- Server_Access_Gateway: 55.1%
- Nutanix: 50.6%
These nodes, while not always generating alerts, act as attack “hubs.”
Insights from the Graph-Based SPOF Analysis
Each type of node centrality offers unique insight in cybersecurity:
Betweenness centrality highlights nodes that act as chokepoints—ideal for SPOF detection.
Closeness centrality reveals nodes that can quickly propagate malware or response actions.
Degree centrality may indicate common access points but not always structural criticality.
PageRank can expose nodes trusted by other key nodes, e.g., authentication hierarchies.
Visibility ≠ Impact: Endpoints like OA_PC trigger many alerts, but offer little strategic value. Central infrastructure nodes, though quiet, are high-leverage targets.
Hidden SPOFs: Nutanix, though rarely flagged, appears in over half of paths.
Misaligned Budgets: Most security spending goes to visible endpoints, not structural enablers.
Real-World Case: SK Telecom Breach, 2025
In the 2025 breach, attackers reportedly accessed large volumes of SIM authentication data. Investigations suggest a centralized HSS server may have played a key SPOF role—yet little investment had been made in redundant design.
This highlights a common pattern: reactive spending after failure, rather than proactive architectural assessment.
Graph Construction and LLM Automation
Input sources included network architecture diagrams, firewall rule descriptions, and internal audit reports—often messy, fragmented, and poorly structured. LLMs converted this documentation into structured graphs. While tools like LangChain can orchestrate workflows, even standalone GPT prompts were effective for initial modeling. Key example:
LLMs converted documentation into structured graphs. While tools like LangChain can orchestrate workflows, even standalone GPT prompts were effective for initial modeling. Key example:
Prompt: "Extract assets and their logical connections from the following network description..."
Output: {
  "nodes": [...],
  "edges": [...]
}
Manual review ensured accuracy. This approach accelerated infrastructure graph creation and supported automated SPOF detection.
SPOF Categorization and Response Strategy
Absolute SPOFs were defined as nodes whose removal caused at least 80% of attack paths to be eliminated or which covered over 30% of total weighted path coverage. This ensured that classification was not solely based on raw frequency but accounted for weighted operational importance as well.
Nodes were classified into four tiers:
Nodes were classified into four tiers:
| SPOF Level | Example Node | Path Drop (%) | Strategy |
|---|---|---|---|
| Absolute | Intranet_MGMT_Server | >50% | Redundancy, hardening |
| Relative | SCCM, AD, Nutanix | 20–50% | Microsegmentation, access control |
| Redundant | OA_PC, VPN_PC | 10–20% | Focused monitoring |
| Low | VDI terminals | <10% | Standard controls |
Conclusion: Prioritize Structural Risk, Not Just Alerts
SPOF identification is not just a diagnostic task—it’s a strategic design imperative. Real security comes from eliminating structural bottlenecks before they become incident headlines.
This method also supports investment justification: organizations can estimate how much path coverage is reduced per dollar invested in reinforcing key nodes.
SPOF identification is not just a diagnostic task—it’s a strategic design imperative. Real security comes from eliminating structural bottlenecks before they become incident headlines.